 Enhanced IR Satellite - realtime (11 mb)
Real-time Color Enhanced Infrared Satellite
Description:
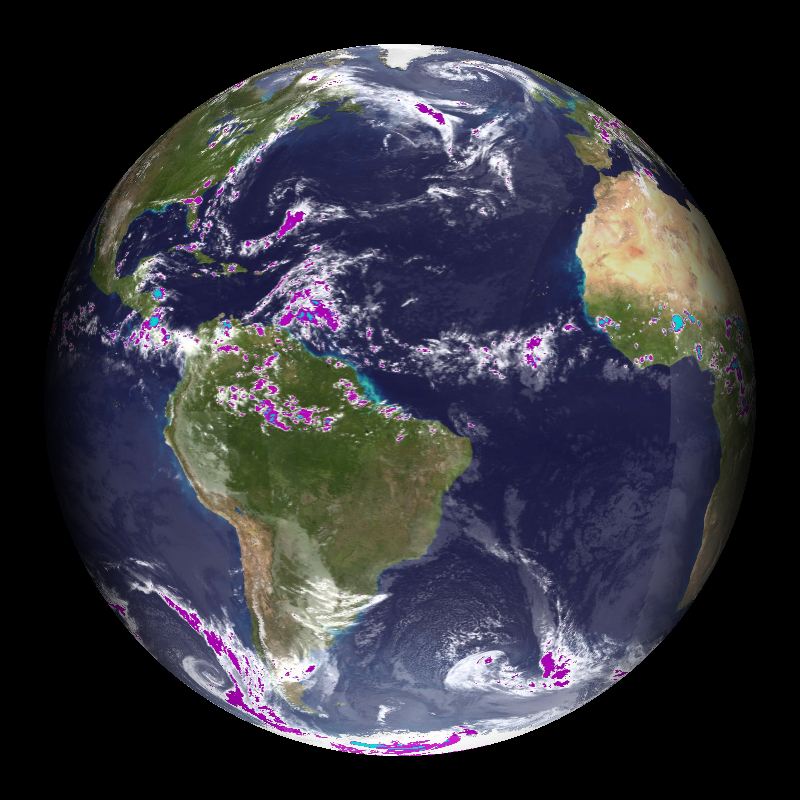
Infrared satellite images are used by meteorologists to determine where clouds are, but more importantly, how the clouds are moving. The infrared, IR, satellites work by measuring the infrared radiation that is emitted. Because the emitted radiation is proportional to temperature, the data are converted to temperature values, which can be useful for meteorologists. In comparison to clouds, the Earth's surface, even on very cold nights, is warm. When there are clouds, they absorb the radiation emitted by the Earth below and emit their own radiation at a much cooler temperature. Any area that has clouds shows up cooler than the ground, allowing meteorologists to detect the locations of the clouds. The height of clouds is inversely proportional to temperature, meaning that the tallest clouds are the coldest. It is often the tallest clouds that bring the most severe weather.
The satellites that collect these data are geostationary, meaning that they rotate at the same rate as the Earth so that the satellites are over the same spot on Earth all the time. This allows them to collect a continuous stream of data for one location so that "movies" of the data can be made. Over the United States there are two such satellites, the GOES (Geostationary Operational Environmental Satellites) -East and GOES-West. World wide there are many such satellites. This dataset is a composite of GOES, Meteosat, and GMS satellite data. Meteosat and GMS are similar to GOES, but operated by other countries. This real-time, color enhanced dataset is shaded so that the significant clouds are brightly colored in order to stand out from the surface. The lowest clouds are white, medium level clouds are shades of purple, and the highest clouds are teal. The background of this image is the "Blue Marble." The data is constinently updated so that the past thirty days of data are available.
Also available is a collection of biweekly IR satellite interpretations by NOAA scientists that can be used with this dataset. The interpretations are plain-language descriptions of notable climate and weather events visible in the cloud patterns of the two-week period indicated. Interpretations are posted every other Tuesday, and are available for the past six months. The interpretations are made available by the American Museum of Natural History, NOAA Climate Prediction Center, and NOAA National Climatic Data Center. To request access to this Google Docs collection please write Laura Allen at laura@amnh.org.
Notable Features:
- Lowest clouds white, medium level clouds purple, and highest clouds teal
- Available in real-time
Data Category
Major: Atmosphere
Keywords:
Atmosphere, IR satellite, real-time, color enhanced, satellite
| Data Set Name | Enhanced IR Satellite - realtime |
| Data Set Directory Name | sat/enhanced |
| Data Set Source | MTSAT |
| Data Set Developer | Fred Mosher, AWC Steve Albers, NOAA/GSD |
| Visualization Developer | Steve Albers, NOAA/GSD |
| Audio | No |
| Download | FTP |