Hurricane Tracks Animation and Cumulative Map
Description:
Tracking historical hurricanes is an important way for hurricane researchers to learn about the paths of future hurricanes. Because of this, records of hurricane paths are archived and studied. Not all hurricanes follow the same path, but there are certainly noticeable trends for hurricane paths. Many computer models that have been created to predict hurricane paths include the historical data in their models.
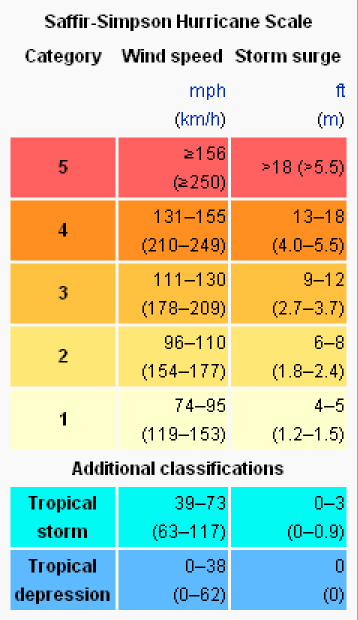
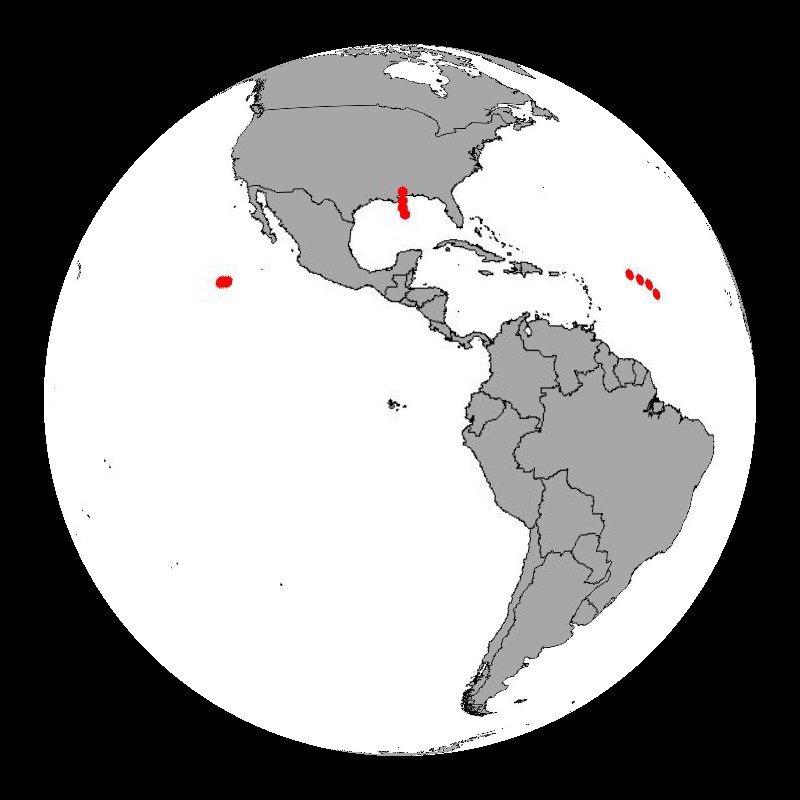
There are two datasets that display hurricane tracks. The first is an animation that runs from January 1, 2000 through October 3, 2006 and displays the tracks of all of the hurricanes that occurred during this time period. The hurricanes are depicted by red dots in the dataset. For each day, the hurricane track appears as a series of four red dots. The red dots are spaced out according to how fast the hurricane was moving. When a hurricane moved very little over a 24 hour period, the four red dots appear clustered together. To represent a hurricane that traveled a long distance in one day the four red dots are spaced to cover that distance. The summer and spring are calm seasons. The hurricane activity begins to pick up late each summer and typically lasts through the fall. The unusually long hurricane season of 2005 can be seen in this dataset. The second dataset shows the paths of all recorded hurricanes worldwide from 1950 - 2005. The dots show the locations of the tropical storms at six hour intervals and are shaded according to the Saffir-Simpson Scale using the provided color bar. Notice that no hurricanes cross the equator.

Notable Features: Animation
- Hurricane tracks from January 1, 2000 through October 3, 2006
- Hurricane tracks represented by red dots
- Spacing of dots proportional to distance traveled in one day
Notable Features: Cumulative Map
- All recorded hurricanes worldwide from 1950 - 2005 are included
- The dots show the locations of the hurricanes at six hour intervals
- No hurricanes cross the equator
-
Data Category
Major: Atmosphere
Keywords:
Atmosphere, hurricanes, tracks
Data Set Name Hurricane Tracks Data Set Directory Name hurricane_tracks/animation Data Set Source National Hurricane Center Data Set Developer Dave Fischman, NOAA/NGDC; John Cartwright, NOAA/NGDC Visualization Developer Mike Biere, NOAA/GSD Audio No Contact Dave Fischman, NOAA/NGDC; John Cartwright, NOAA/NGDC Download FTP
Data Set Name Accumulative Hurricane Tracks 1950 - 2005 Data Set Directory Name hurricane_tracks/cumulative Data Set Source National Hurricane Center, Joint Typhoon Warning Center Data Set Developer National Hurricane Center, Joint Typhoon Warning Center Visualization Developer Nilfanion Audio No Contact Nilfanion Download FTP


 Hurricane Tracks (1mb)
 Accumulative Hurricane Tracks 1950 - 2005 (9 mb)