Real-time Total Precipitable Water
Description:
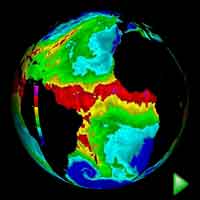
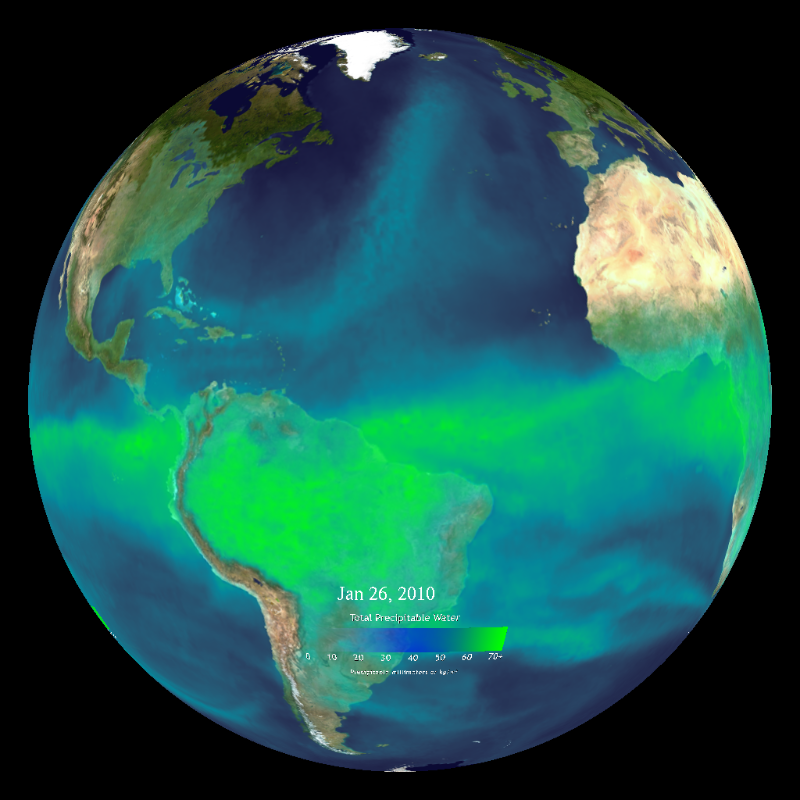
The atmosphere contains an enormous amount of moisture that circulates around the globe. However, not all of it actually condenses into rain, sleet, or snow since the right balance of pressure and temperature are needed to create precipitation. Total precipitable water (TPW) in the atmosphere is the amount of water that can be obtained from the surface to the "top" of the atmosphere if all of the water and water vapor were condensed to a liquid phase. Significant features that can be identified in TPW data are the atmospheric rivers that flow off the oceans and onto coastal land areas. A famous example is the Pineapple Express that forms in the Northeast Pacific and impacts the Northwest United States. Also notice how TPW values are much greater over the equator and ocean. High levels of evaporation in these areas are one of the primary drivers of atmospheric circulation.
The land, ocean, and atmosphere all emit microwave radiation which can be measured by sensors on satellites, allowing scientists to study various aspects of the Earth. Microwave sounders are able to measure very low levels of microwave radiation naturally emitted by the Earth at different frequencies. Even water vapor emits microwave radiation that can be measured by microwave sounders. There are two datasets for TPW for Science On a Sphere. The first dataset uses data from the Advanced Microwave Sounding Unit, AMSU, which is attached to the NOAA Polar Environmental Orbiting Satellites NOAA 15, NOAA 16, and NOAA 17. Each satellite provides full coverage of the Earth everyday by orbiting the globe 14.1 times per day collecting a swath of data 1426 miles wide on each orbit. The second dataset uses data from the AMSU and the Special Sensor Microwave Imager, SSM/I, which is carried on Defense Meteorological Satellite Program satellites. Both are provided in near real-time. The AMSU dataset is updated hourly and the AMSU/SSMI combined dataset is updated daily.

Notable Features:
- Tropics generally have high total precipitable water
- Areas of high total precipitable water typically indicated clouds and precipitation

Data Category
Major: Atmosphere
Keywords:
Atmosphere, total precipitable water, satellite
| Data Set Name | NESDIS AMSU-Precipitable H2O - realtime |
| Data Set Directory Name | sat/amsu-pw-rt |
| Data Set Source | Advanced Microwave Sounding Unit Project |
| Data Set Developer | National Environmental Satellite, Data, and Information Service |
| Visualization Developer | Steve Albers, NOAA/GSD |
| Audio | No |
| Download | FTP |
| Data Set Name | Total Precipitable Water - Realtime |
| Data Set Directory Name | precipitable_water |
| Data Set Source | Advanced Microwave Sounding Unit Project and Special Sensor Microwave Imager |
| Data Set Developer | NOAA Visualization Lab |
| Visualization Developer | NOAA Visualization Lab |
| Audio | No |
| Contact | NOAA Visualization Lab |
| Download | FTP |
| Date Added | January 2010 |


 NESDIS AMSU-Precipitable H2O - realtime (3 mb)
 Total Precipitable Water - Realtime