 Earth at Night (5 mb)
Earth at Night
Description:
This visualization uses the same database as the nighttime side of the Hot Topo visualization. The data was recorded by the Defense Meteorological Satellite Program, DMSP, in the National Geophysical Data Center. The Earth Observation Group in the NGDC maintains the archived data, performs research on the data, and makes products utilizing the data available. The data was collected using polar orbiting satellites that provide full cover of the globe twice a day. The satellites have an Operation Linescan system which allows them to detect low levels of visible-near infrared radiance at night. With this data, it is possible to detect clouds illuminated by moonlight, lights from cities and towns, industrial sites, gas flares, fires, lightning, and aurora. The Nighttime Lights of the World data set was complied from DMSP data spanning October 1994 - March 1995.
 Colorized Nighttime Light for August 30, 2005. Any widespread area that is red suggests a power outage. Learn more here
This particular visualization shows only the lights generated from electricity. The oceans are shaded a very dark blue and the land is shaded a slightly lighter blue so that they can be distinguished. All of the lights are bright white. Areas of high economic prosperity and/or population are generally the areas that are well illuminated. Most of the coast lines are well highlighted, as it seems people like to live by the water. The Nile River in Africa it outlined by the lights that border it. In the United States, it is visible that the eastern half of the country is more densely populated than most other areas. Major highways can be identified by the lights along them.
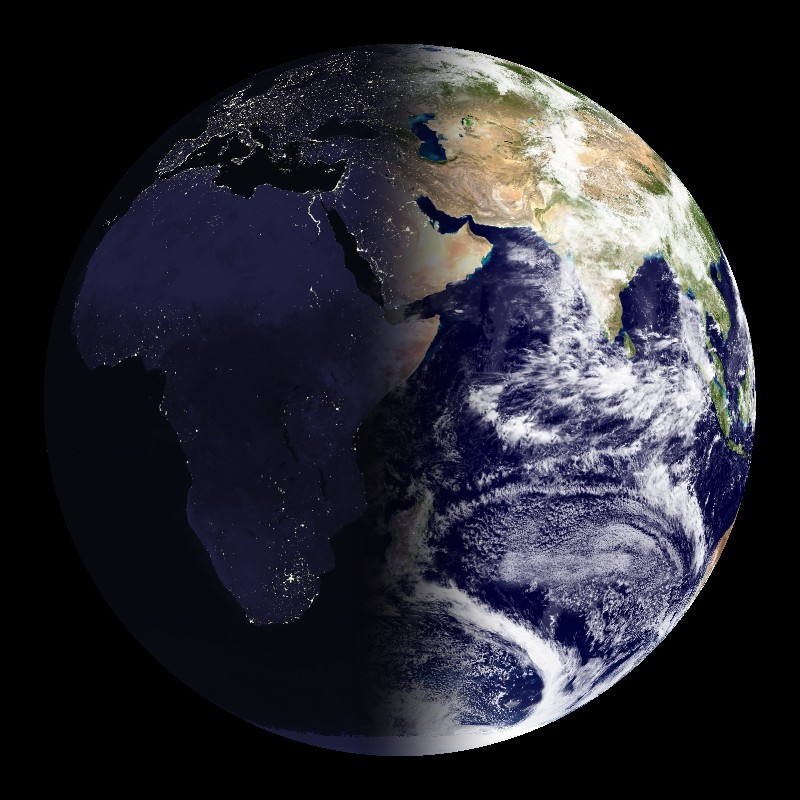 Blue Marble and Nightlights (9 mb)
Special colorized versions of these maps can also be used to detect power outages. This is done by comparing an annual composite image against data from one night. The lights in the composite image are shaded red, the visible data from the one night is shaded green and the thermal data from the one night is shaded blue. The result is clouds show up blue, lights that are on during both time periods show up yellow, lights that were on only on the single night show up green and lights that were on in the composite image, but not the one night show up red. Any widespread area that is red suggests a power outage. Two images from August 30, 2005, right after Hurricane Katrina hit, are available to display on the sphere as a picture in a picture. The first is a black and white image of the lights from August 30 and the second is the same image, but colorized to highlight the widespread power outages.
 Colored Night Lights (22 mb)
There are three additional variations of the nighttime lights map. The first dataset is the nighttime lights merged with the Blue Marble dataset. The new dataset shows the Earth with daytime and nighttime views of the Earth, to demonstrate how only half of the Earth is illumintated at one time. The second dataset is similar to the original nighttime lights dataset, but the lights have been colorized based on the light source. The white represents lights generated from electricity, the red shading shows fires, the pink shading indicates light from squid fishing boats, and the blue spots are gas flares from oil rigs. The third variation is two maps, one with electric lights from 1992, the second with electric lights from 2002. By comparing the two images, viewers can see areas of growth and decline.
 Nightlights Changes 1992 - 2008
There are also additional updates to this dataset. The first is a color composite of three years - 1992, 2000, 2008 - of DMSP nighttime lights. Each year has been assigned to one of the primary colors: 1992 = blue, 2000 = green, 2008 = red. The contrast has been enhanced to show all the detected lights, including the dim lighting often detected in populated rural areas. Locations that had bright lighting in all three years are white. There are many rural areas in India and elsewhere that have a bronze color, indicating that they had no detected lighting in 1992 and dim lighting detected in both 2000 and 2008. Notice the areas of blue lighting in several parts of the Former Soviet Union, the result of collapse and loss of lighting in the mid-1990's. The second is similar, but only compares two years - 1992 and 2009 - of DMSP nighttime lights. In this dataset, purple represents a decrease in light levels, white represents no change in light levels and yellow represents an increase in light levels. Both of these datasets are available with and without country borders. For more information about the comparision dataset, visit here.
 Nightlights Changes 1992 - 2009 (28 mb)
Notable Features:
- Nile River outlined by lights
- Eastern U.S. highly populated
- Major highways outlined by lights
Data Category
Major: Land
Keywords:
Land, nighttime lights, DMSP, NGDC
| Data Set Name | Earth At Night |
| Data Set Directory Name | earth_night/nightlights |
| Data Set Source | DMSP |
| Data Set Developer | NGDC Earth Observations Group |
| Visualization Developer | NGDC Earth Observations Group |
| Audio | No |
| Download | FTP |
| Data Set Name | Blue Marble and Nightlights |
| Data Set Directory Name | bluemarble_nightlights |
| Data Set Source | DMSP, NASA GSFC |
| Data Set Developer | NGDC Earth Observations Group, NASA GSFC |
| Visualization Developer | Steve Albers, NOAA/GSD |
| Audio | No |
| Download | FTP |
| Data Set Name | Colored Night Lights |
| Data Set Directory Name | earth_night/color_nightlights |
| Data Set Source | DMSP |
| Data Set Developer | NOAA NGDC Earth Observations Group |
| Visualization Developer | NOAA NGDC Earth Observations Group |
| Audio | No |
| Download | FTP |
| Data Set Name | Nightlights Comparison 1992, 2002 |
| Data Set Directory Name | earth_night/1992_2002 |
| Data Set Source | DMSP |
| Data Set Developer | NOAA NGDC Earth Observations Group |
| Visualization Developer | NOAA NGDC Earth Observations Group |
| Audio | No |
| Download | FTP |
| Data Set Name | Nightlights Changes 1992 - 2008 |
| Data Set Directory Name | earth_night/1992_2008 |
| Data Set Source | DMSP |
| Data Set Developer | NOAA NGDC Earth Observations Group |
| Visualization Developer | NOAA NGDC Earth Observations Group |
| Audio | No |
| Download | FTP |
| Date Added | April 2010 |
| Data Set Name | Nightlights Changes 1992 - 2009 |
| Data Set Directory Name | earth_night/1992_2009 |
| Data Set Source | DMSP |
| Data Set Developer | NOAA Environmental Visualization Lab |
| Visualization Developer | NOAA Environmental Visualization Lab |
| Audio | No |
| Download | FTP |
| Date Added | August 2011 |