 Drought Risk - Realtime
Real-time Drought Risk
Description:
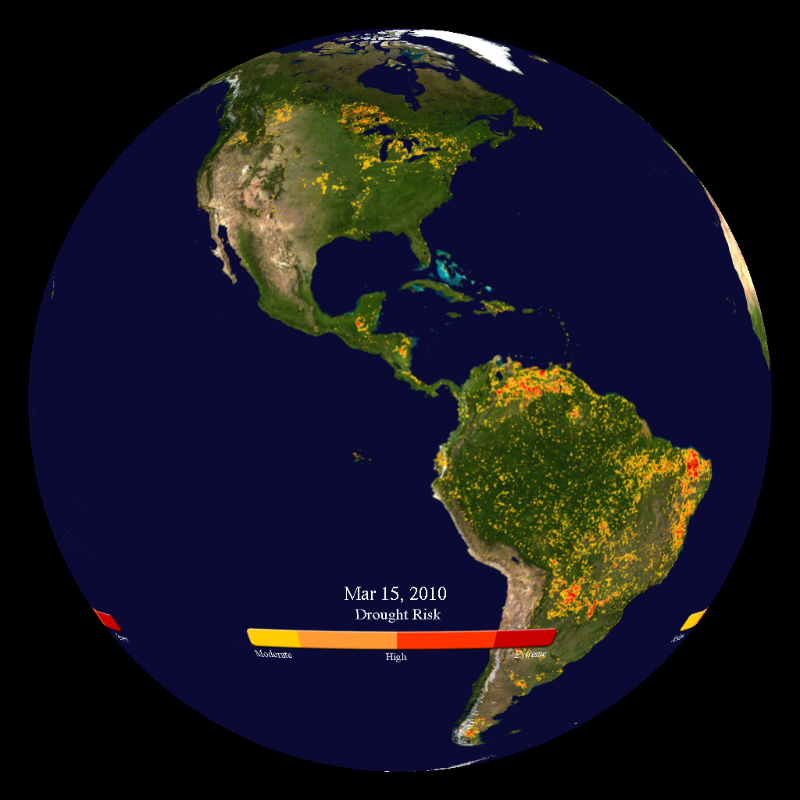
Satellites can detect the difference between rock, grassland, and forests because these surfaces emit energy differently back into space. By measuring these differences and observing the patterns of vegetation --or its lack of growth--NOAA scientists can monitor how droughts are changing across the world through time.
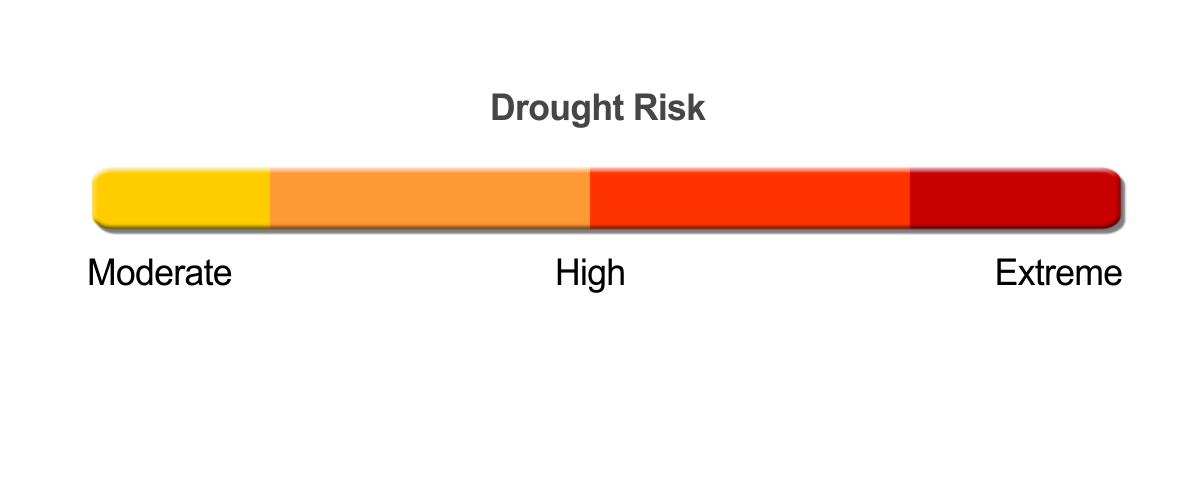
This global drought risk composite is derived from the Normalized Difference Vegetation Index datasets developed by NOAA from measurements of the AVHRR sensor onboard the POES satellite. By monitoring vegetation health, moisture and thermal conditions, scientists are able to identify areas that are considered to be vegetatively stressed due to drought. An important note is that the drought imagery is based solely on the analysis of vegetation health and stress, not soil moisture conditions. But this index serves as a reliable proxy measurement for drought worldwide. Areas of desert and snow cover are not included in the analysis. Yellow areas indicate areas under moderate drought conditions; red indicates areas experiencing extreme drought conditions. A number of other datasets are also being derived from NDVI, including risk indexes for wildfires and malaria. This dataset is updated weekly.
Notable Features:
- Location and intensity of drought changes with the seasons
- Drought Risk is updated weekly
Data Category
Major: Land, Real-time
Keywords:
Land, drought, seasons
| Data Set Name | Drought Risk - Realtime |
| Data Set Directory Name | drought |
| Data Set Source | NOAA |
| Data Set Developer | NOAA Visualization Lab |
| Visualization Developer | NOAA Visualization Lab |
| Audio | No |
| Download | FTP |
| Date Added | March 2010 |