 Earthquake Hi-res Animation (1 mb)
Real-time Global Earthquakes
Description:
Earthquakes occur naturally everyday. Anything that causes seismic waves to radiate throughout the Earth is an earthquake. There are two main types of earthquakes, tectonic and anthropogenic (caused by humans). Tectonic earthquakes are naturally occurring and are caused by earth movement. The surface of the Earth is composed of a mosaic of tectonic plates moving with respect to each other. When two plates glide past one another, a stress builds up at the boundary. When that stress reaches a critical level, the boundary slips and the result is an earthquake. The traces of repeated slips are known as fault lines. Anthropogenic earthquakes can be caused by drilling for fossil fuels, extraction of minerals, huge explosions, and the collapse of large buildings.
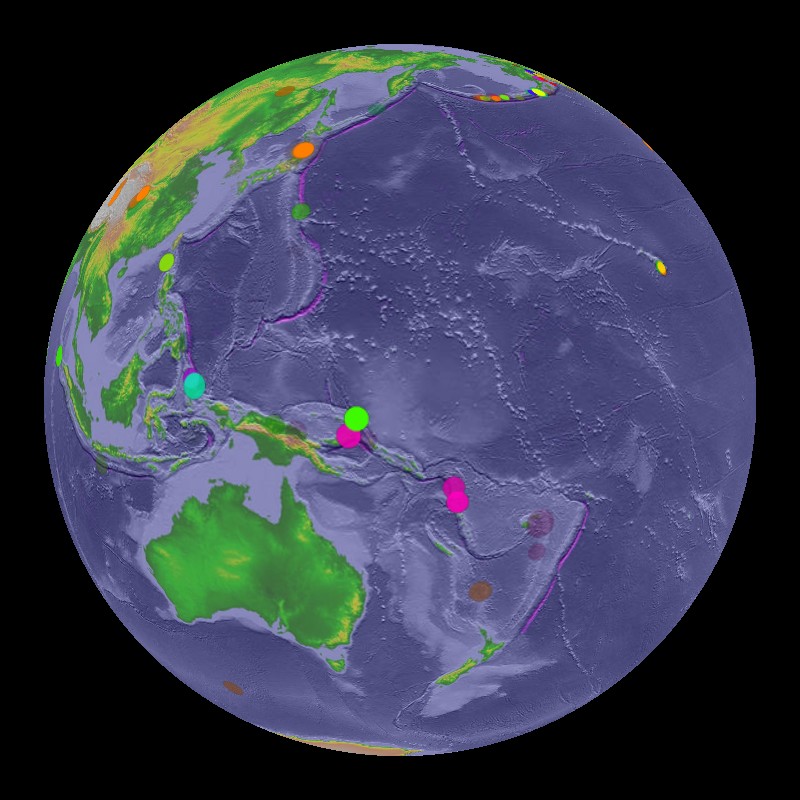
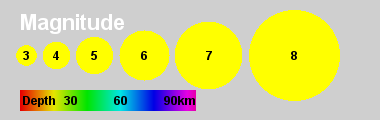
Most earthquakes are small enough to hardly be noticed; however, some can be very powerful causing widespread death and destruction and can even trigger tsunamis. The Richter magnitude scale was created to rate the strength and magnitude of earthquakes. It is a base-10 logarithm scale of ground motion 100km from the epicenter. Each increase of 1 magnitude means 10 times greater ground motion. To measure the amount of energy that was released during an Earthquake, a base 32 logarithm scale is used. This real-time dataset shows the earthquakes that daily happen around the world that are greater than 2.5 on the Richter scale. With the current database from the USGS, many earthquakes outside of the United States under 4-5 magnitude on the Richter scale are not reported. The size of the circle is proportional to the magnitude of the earthquake, with bigger values on the Richter scale represented by bigger circles. The coloring of the circles is based on the depth of the earthquake below the surface according to the provided color bar. After an earthquake occurs, the representing circle fades out over a seven day period. This dataset is updated hourly.
Notable Features:
- Circles indicate earthquake; size indicates magnitude, color indicates depth
- Majority of earthquakes along plate boundaries
Data Category
Major: Land, Real-time
Keywords:
Land, earthquake, plate tectonics, real-time
| Data Set Name | Earthquake Hi-res Animation (2K - with legend) |
| Data Set Directory Name | quake |
| Data Set Source | United States Geological Survey |
| Data Set Developer | Steve Albers, NOAA/GSD |
| Visualization Developer | Steve Albers, NOAA/GSD |
| Audio | No |
| Download | FTP |