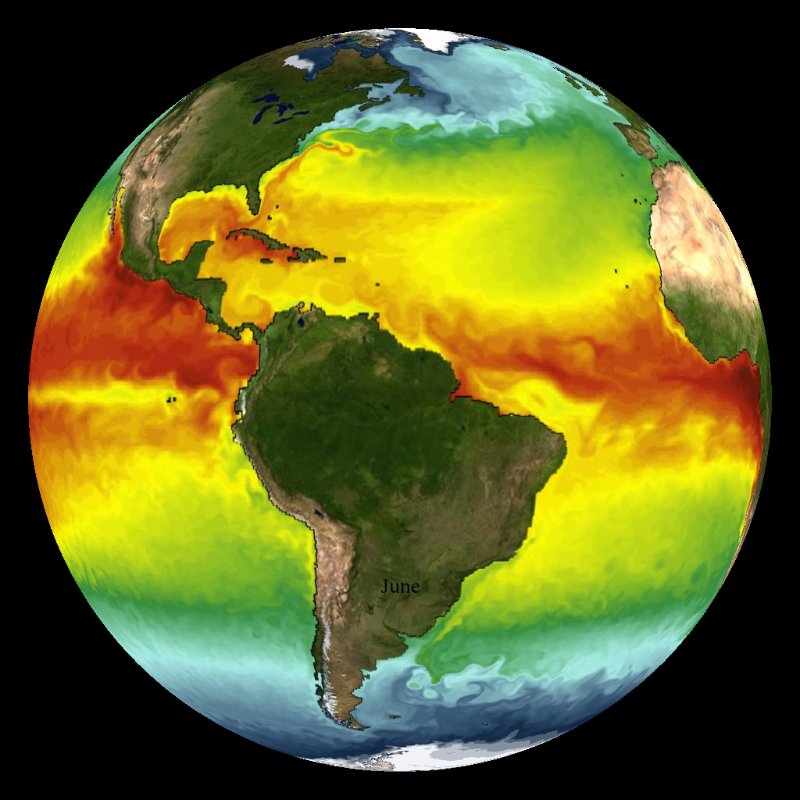
 GFDL SST Model with Land Background (9 mb)
GFDL Global Sea Surface Temperature Model
Description:
This dataset shows how the global ocean's surface water temperatures vary over the course of few years. In addition to seeing the effects of the seasonal cycle, the viewer can see how surface ocean currents and eddies transport heat and water around the globe. The images were generated not from observations, but from a state-of-the-art computer model of Earth's climate created at NOAA's Geophysical Fluid Dynamics Laboratory (GFDL).
The sea surface temperature (SST) at a particular location is influenced by a number of factors, including the amount of sunlight that reaches the ocean. Because our planet's axis is tilted about 23.5 degrees, the intensity of sunlight that reaches different latitudes varies as the Earth orbits the Sun once a year, leading to the seasons. In this dataset, one can follow the progression of the seasons as the colors representing the warmest and coldest SSTs appear to migrate northward and southward during the course of a year. (For related information see Modeling the Reasons for Seasonal Change and Seasonal Change on Land and Water, classroom resources provided by The GLOBE Program.)
Surface ocean currents transport large amounts of water, salt, and heat throughout the ocean. Because the Sun makes the tropics warmer than the poles, ocean currents and atmospheric winds tend to carry heat from the tropics to the polar regions. The ocean's ability to transport heat energy makes it an important part of the global climate system. Did you know that the top two meters of ocean water contain as much heat as the entire column of air above them?
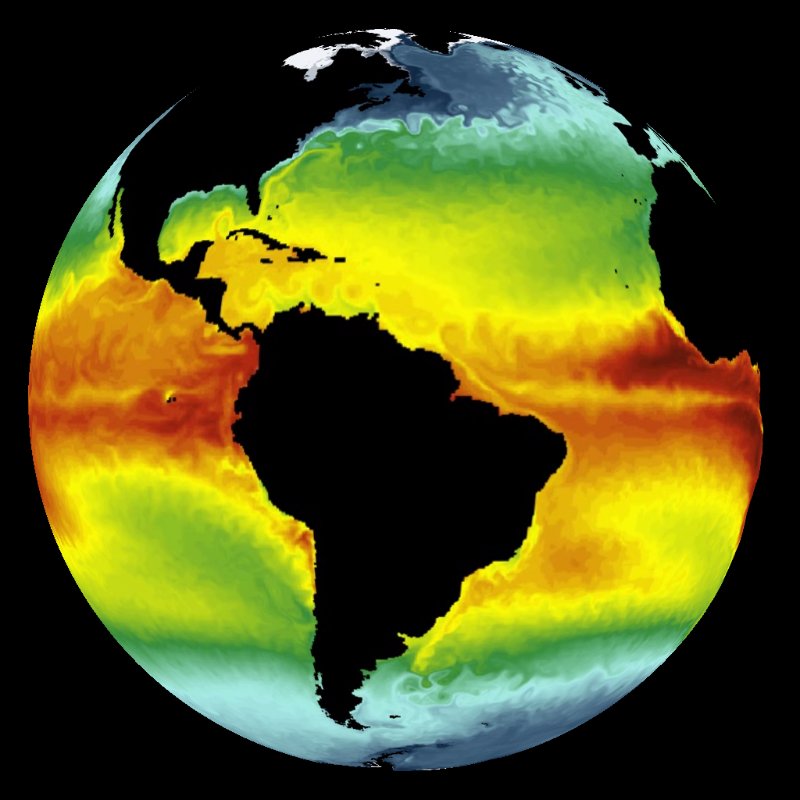 GFDL SST Model with Black Background (6 mb)
The patterns and strengths of surface ocean currents are influenced by a number of factors. Surface ocean currents are largely driven by winds, but they are also greatly affected by the Earth's rotation, the location of continents, and processes occurring within the ocean itself - the ocean's internal dynamics. When watching this dataset, notice that many of the major surface currents lie off the east coasts of continents, or what oceanographers refer to as the western boundaries of ocean basins. Earth's spherical shape and daily rotation rate are responsible for this asymmetry, which helps determine the regional patterns of poleward moving warm surface currents and equatorward moving cool surface currents in ocean basins.
For example, warm surface water flowing from the tropical and subtropical Atlantic gains the name The Gulf Stream as it moves northward along the east coast of Florida to North Carolina before leaving the coast to head northeastward across the Atlantic. Along their edges, fast moving currents like the Gulf Stream spawn spinning rings of water referred to as turbulent eddies. Together, the central core of the Gulf Stream and the eddies both help transport heat energy. You can see a similar current and eddies in the northwest Pacific, where the Kuroshio Current travels northward along the east coast of Japan before turning to flow eastward across the Pacific Ocean.
There are two versions of this dataset available, one with a black land background and one with a shaded vegetation land background. For more information about the currents visible in this SOS dataset watch the "Modeling Dynamic Surface Ocean Current" video available at http://www.gfdl.noaa.gov/e-media-produced-by-gfdl-ccvp#oceancurr .
Computer climate models, like the one from which this sea surface temperature animation was derived, are powerful tools used to improve our understanding of our planet's climate and how it varies on seasonal, annual, decadal, and centennial time scales. Though this dataset only displays model-simulated sea surface temperatures, global climate models consist of a set of interconnected three-dimensional numerical ocean and atmosphere models, as well as models of sea ice and land surface processes. See http://www.gfdl.noaa.gov/climate-modeling for more background information on climate modeling. The model used in this dataset is the GFDL CM2.5v1, produced by NOAA GFDL 's Climate Change, Variability and Prediction Group (http://www.gfdl.noaa.gov/ccvp).

Notable Features:
- The mid-latitudes tend to have the greatest seasonal change in sea surface temperature, while the equator remains warm and poles remain cool through the year
- Surface ocean currents and eddies transport heat and water around the globe
- Many of the major surface currents lie off the east coasts of continents
Data Category
Major: Ocean
Keywords:
Ocean, sea surface temperature
| Data Set Name | GFDL SST Model with Land Background |
| Data Set Directory Name | gfdl_sst/land_background |
| Data Set Source | NOAA Geophysical Fluid Dynamics Laboratory, GFDL CM2.5v1 climate model |
| Data Set Developer | Whit Anderson, Tom Delworth, Keith Dixon, Anthony Rosati, NOAA GFDL |
| Visualization Developer | Simon Su, Keith Dixon, NOAA GFDL |
| Science Content Contact | Keith Dixon, Whit Anderson, NOAA GFDL |
| Audio | No |
| Download | FTP |
| Date Added | June 2011 |
| Data Set Name | GFDL SST Model with Black Background |
| Data Set Directory Name | gfdl_sst/black_background |
| Data Set Source | NOAA Geophysical Fluid Dynamics Laboratory, GFDL CM2.5v1 climate model |
| Data Set Developer | Whit Anderson, Tom Delworth, Keith Dixon, Anthony Rosati, NOAA GFDL |
| Visualization Developer | Simon Su, Keith Dixon, NOAA GFDL |
| Science Content Contact | Keith Dixon, Whit Anderson, NOAA GFDL |
| Audio | No |
| Download | FTP |
| Date Added | June 2011 |