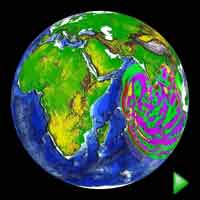
 Indian Tsunami V3 (8 mb)
Indian Ocean Tsunami Model, December 26, 2004
Description:
This dataset is a model put together by the Pacific Marine Environmental Laboratory that simulates the waves of the December 26, 2004 tsunami the first thirty-six hours after it occurred. A tsunami is a series of waves generated when a body of water, such as an ocean, is rapidly displaced on a massive scale. Historically tsunamis have been referred to as tidal waves, but that name is discouraged by oceanographers because tides have little effect on tsunamis. There are two versions of this dataset, which are essentially the same with only the color scales changed. In the first, the yellow shading represents the crest of the wave, which is 20cm up to 1m above sea level and the red shading represents the trough of the wave, which is 20cm up to 1m below sea level. The purple shading shows subsequent peaks 0 - 20cm high and the green shading equates to subsequent troughs 0 - 20cm. In the second dataset, the color ranges from light blue for troughs 50cm below sea level and yellow for ridges 50cm above sea level. A color bar is included for this version.
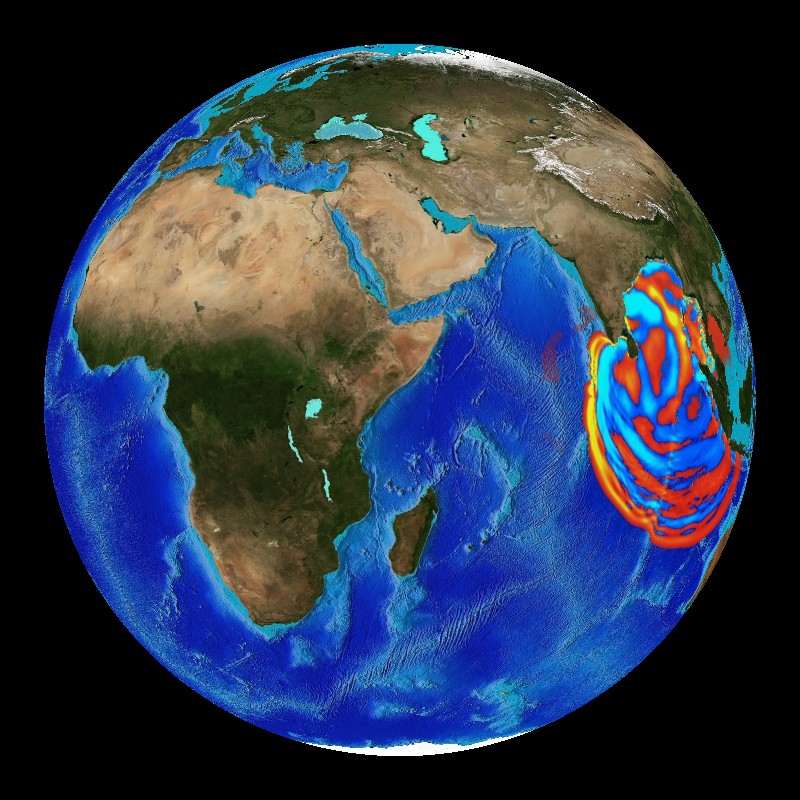 Indian Ocean Tsunami - new (7 mb)
The infamous Sumatra Tsunami on December 26, 2004 was the result of a massive earthquake that occurred when the India tectonic plate subducted beneath the Burma plate, causing an earthquake with a magnitude of at least 9.0 on the Richter scale which displaced a huge amount of water. Out in the depths of the ocean, the wave heights do not increase dramatically. But as the waves travel inland, the depth of the ocean gets shallower causing the waves to build up. Waves with heights of 35.5 feet were reported during the Sumatra Tsunami. The speed of the waves depends on the ocean depth rather than the distance from the source of the wave. The waves travel faster over deep waters and slower over shallow waters as they build up. This allowed the Sumatra Tsunami to propagate worldwide in just one day. An estimated 230,000 people were killed as a result of the tsunami, 168,000 in Indonesia alone. One reason for the widespread devastation was the lack of a warning system. Previously thought unnecessary in the Indian Ocean because the last major tsunami was in 1883, efforts are underway by the NOAA Center for Tsunami Research to make a worldwide tsunami detection system a reality.
 Color bar for Indian Ocean Tsunami Model, version 2
Notable Features:
- The incredible rate at which the wave propagates
- The resonance of the waves that batter countries bordering the Indian Ocean
Data Category
Major: Ocean
Keywords:
Ocean, Tsunami, PMEL
| Data Set Name | Indian Tsunami V3 |
| Data Set Directory Name | indian_tsunami |
| Data Set Source | Pacific Marine Environmental Laboratory |
| Data Set Developer | Pacific Marine Environmental Laboratory |
| Visualization Developer | David Himes, NOAA/GSD |
| Audio | No |
| Download | FTP |
| Data Set Name | Indian Ocean Tsunami (new) |
| Data Set Directory Name | indian_tsunami/new |
| Data Set Source | Pacific Marine Environmental Laboratory |
| Data Set Developer | NOAA Center for Tsunami Research |
| Visualization Developer | NOAA Center for Tsunami Research |
| Audio | No |
| Download | FTP |