 Japan Tsunami Wave Propagation, March 11, 2011 (10 mb)
Japan Tsunami Wave Propagation and Combo, March 11, 2011
Description:
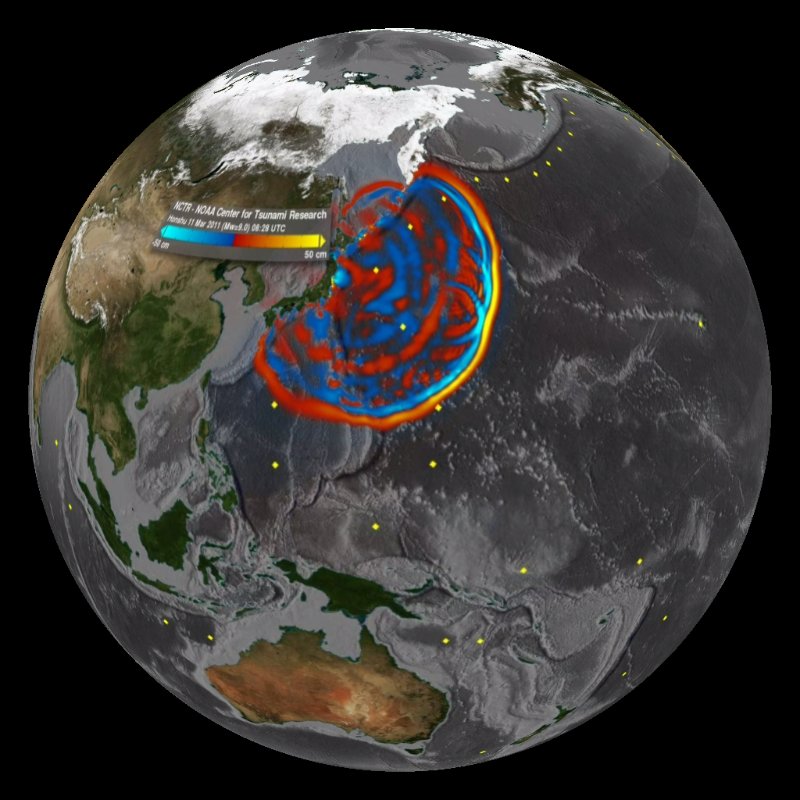
On March 11, 2011 at 2:45 p.m. local time, a 9.0 magnitude earthquake occurred 81 miles (130 km) off the east coast of Sendai, Honshu, Japan, triggering a massive tsunami. A tsunami is a series of ocean waves generated by sudden displacements in the sea floor, landslides, or volcanic activity. In the deep ocean, the tsunami wave may only be a few inches high. The tsunami wave may come gently ashore or may increase in height to become a fast moving wall of turbulent water several meters high. Forecasted wave heights in Japan were up to 66 ft (20 m) and there were many reports of tsunami waves three stories high in parts of Japan. Across the Pacific Ocean, many countries issued evacuations along the coasts because of the predicted tsunami waves. Propagation of the tsunami was computed with the NOAA forecast method using the MOST (Method of Splitting Tsunami) model with the tsunami source inferred from DART data. Approximately 25 minutes after the earthquake, the tsunami was first recorded by one of the DART buoys.
 Japan Earthquake, Tsunami Propagation, and Wave Height Combo (8 mb)
The NOAA Center for Tsunami Research, located at NOAA PMEL in Seattle, WA runs the MOST model and produced this dataset. The main objective of the forecast model is to provide an estimate of wave arrival time, wave height and inundation area immediately after a tsunami event. Tsunami forecast models are run in real time while a tsunami is propagating in the open ocean, consequently they are designed to perform under very stringent time limitations. In addition to the forecasted 66 ft wave heights, the model also shows over 130 ft (40 m) of runup, which is the highest topographic elevation that the tsunami reaches. Observations have confirmed the runup height of 130 ft in parts of Japan. As the tsunami radiated out from Japan, it encountered the complex topography and bathymetry of sea floor, causing the wave to scatter and reflect. After 8 hours, the tsunami hit Hawaii and after 9.5 hours, the tsunami made landfall on the west coast of the United States. At the 16 hour mark, the tsunami wave entered the Indian Ocean and at the 22 hour mark, the wave had propagated throughout the entire Pacific Ocean and was an incredibly complex wave due to the varied topography and bathymetry of the sea floor. The yellow dots mark the locations of the DART buoys. The final frames of this dataset show the maximum wave amplitude and the arrival time of the tsunami wave.
A second version of this dataset combines the Wave Propagation model with the other Japan Tsunami datasets that are available here. It starts by showing the earthquake activity leading up to the tsunami, then shows the tsunami wave propagation combined with earthquake activity and then ends with a map of maximum wave heights.
Notable Features:
- The first half of the dataset shows the tsunami wave propagation as forecasted by the MOST model
- Yellow dots mark the locations of DART buoys
- The second half of the dataset shows the maximum wave amplitudes with travel time for the tsunami wave
Data Category
Ocean
Keywords:
Ocean, tsunami, Japan, earthquake, NOAA, DART
| Data Set Name | Japan Tsunami Wave Propagation, March 11, 2011 |
| Data Set Directory Name | japan_tsunami_waves |
| Data Set Source | NOAA Center for Tsunami Research |
| Data Set Developer | NOAA Center for Tsunami Research |
| Visualization Developer | Chris Moore, NOAA Center for Tsunami Research |
| Audio | No |
| Contact | Chris Moore, NOAA Center for Tsunami Research |
| Download | FTP |
| Date Added | March 2011 |
| Data Set Name | Japan Earthquake, Tsunami Propagation, and Wave Height Combo |
| Data Set Directory Name | japan_tsunami_waves/combo |
| Data Set Source | NOAA Center for Tsunami Research, USGS |
| Data Set Developer | NOAA Center for Tsunami Research, USGS |
| Visualization Developer | NOAA |
| Audio | No |
| Download | FTP |
| Date Added | August 2011 |