 Sealevel Changing in every 10 meters from SMM (1 mb)
Sea Level Rise
Description:
There are many questions surrounding climate change. One big question is how the changing climate will affect the oceans. The sea level has been steadily rising since 1900 at a rate of 1 to 2.5 millimeters per year. In fact, since 1992 new methods of satellite altimetry using the TOPEX/Poseidon satellite indicate a rate of rise of 3 millimeters per year. The Fourth Assessment Report from the IPCC states that "there is strong evidence that global sea level gradually rose in the 20th century and is currently rising at an increased rate, after a period of little change between AD 0 and AD 1900. Sea level is projected to rise at an even greater rate in this century. " - Fourth Assessment Report on Sea Level Rise Sea level can rise by two different mechanisms with respect to climate change. The first is the expansion of the sea water as the oceans warm due to an increasing global temperature. The second mechanism is the melting of ice over land, which then adds water to the ocean. The IPCC Fourth Assessment Report predicts that total global-average sea level rise from 1990 - 2100 will be 7 - 15 inches for low emission scenarios and 10 - 23 inches for high emission scenarios.
 Impact of 6 meter Sea Level Rise Red (1 mb)
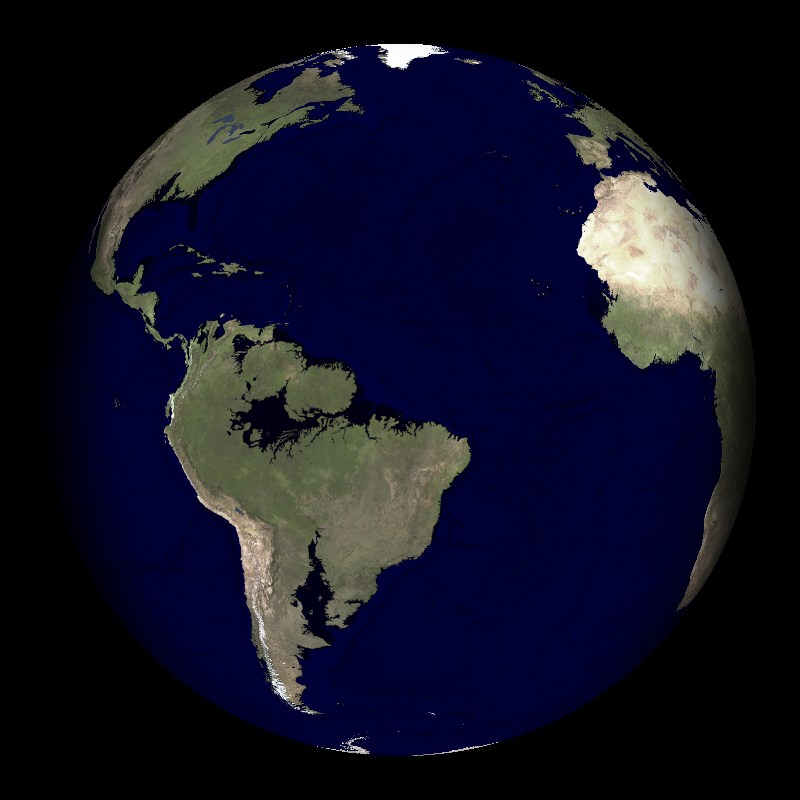
There are two Science On a Sphere datasets that demonstrate rising sea levels and show the changes in the Earth's appearance as the sea levels rise. The first dataset starts with sea level 150 meters below its present level. The areas that appear white are land that would be uncovered if the sea level was below the current level. The animation proceeds in 10 meter increments, increasing up to 80 meters above the current sea level. Current land masses that would be covered by the rising sea level are shaded black. The National Snow and Ice Data Center predicts that if both Antarctica and Greenland, the world's largest ice sheets, both melted completely, the sea level would rise more than 70 meters. The second dataset shows the sea level rising meter by meter from current sea level up to 6 meters above sea level. The land that would be covered by water is shaded red to show the drastic decrease in land as the waters rise. The same dataset is also available with black shading for land covered by water.
Notable Features:150m below to 80m above Sea Level
- Land shaded white is currently covered with water, land shaded black would be covered by water if sea levels rose
- Many islands connected when sea level is below current level
- The interior of the Amazon fills
6m Rise in Sea Level
- Shading in either red or black represents land that would be covered by rising sea levels
- Much of the eastern United States disappears when levels rise above current level
Data Category
Major: Ocean
Keywords:
Ocean, sea level, climate change
| Data Set Name | Sealevel Changing in every 10 meters from SMM |
| Data Set Directory Name | sea_level |
| Data Set Source | Science Museum of Minnesota |
| Data Set Developer | Science Museum of Minnesota |
| Visualization Developer | Science Museum of Minnesota |
| Audio | No |
| Contact | Science Museum of Minnesota |
| Downlaod | FTP |
| Data Set Name | Impact of 6 meter Sea Level Rise (red) Impact of 6 meter Sea Level Rise (black) |
| Data Set Directory Name | 6m_sea_level_rise/red 6m_sea_level_rise/black |
| Data Set Source | John C. Kostelnick, College of Mathematics and Natural Sciences, Haskell Indian Nations University |
| Data Set Developer | John C. Kostelnick, College of Mathematics and Natural Sciences, Haskell Indian Nations University |
| Visualization Developer | NASA Goddard Space Flight Center |
| Audio | No |
| Contact | NASA Goddard Space Flight Center |
| Downlaod | FTP |