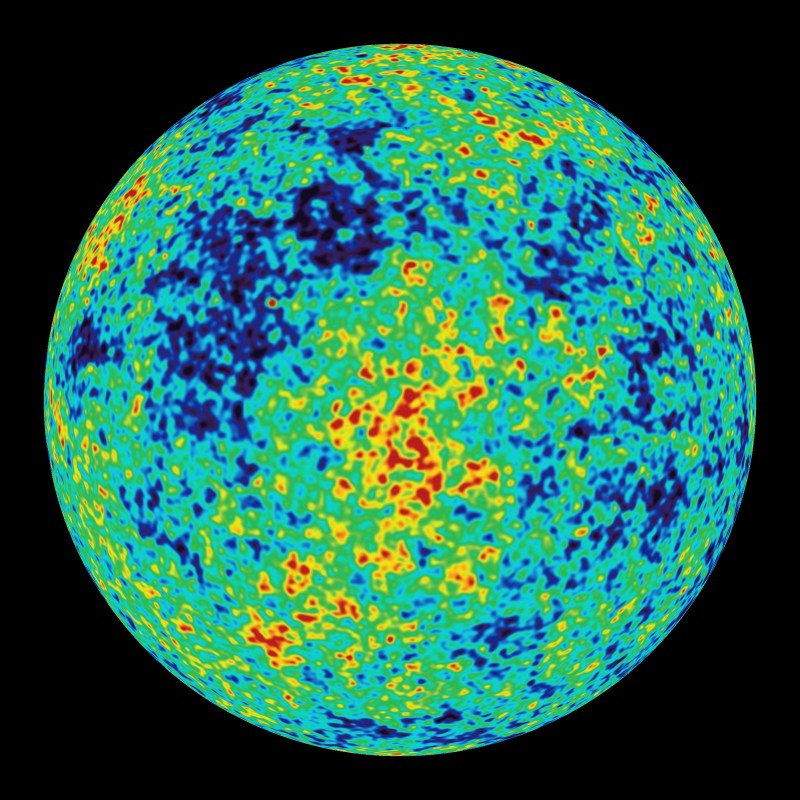
Universe WMAP Microwave Background
Description:
" Wilkinson Microwave Anisotropy Probe, WMAP, is a NASA Explorer mission measuring the temperature of the cosmic background radiation over the full sky with unprecedented accuracy. This map of remnant heat from the Big Bang provides answers to fundamental questions about the origin and fate of our universe. " — From the NASA/WAMP website The probe is over 930,000 miles from Earth and effectively scans the entire sky every six months.
Temperature fluctuations displayed here are 13.7 billion years old, from the time when the Big Bang was thought to have occurred. Essentially, it is a detailed, all-sky display of the young universe developed from three years of WMAP data. The blue areas are cooler while the red areas are warmer. The temperature range on this map is ± 200 microKelvin, which is incredibly small. The temperature range is so small because it doesn’t measure absolute temperature but anisotropy. Anisotropy is the difference between two measurements taken in opposite directions. This is much more accurate than simply measuring the absolute temperature in one direction. This data is used to support the Big Bang theory using inflation. The concept is that the universe expanded many trillion times its size in less than a trillionth of a second at the beginning of the Big Bang. This is a map of the remnant heat left from the big bang. According to NASA, the measurements reveal size, matter content, age, geometry, and the fate of the universe. There are two versions of this WMAP data. The first dataset is from the first year of data collected by WMAP and is lower resolution. The second dataset is from the third year of data collected and is polarized and has a higher resolution. In this third year dataset, the formation site of the Milky Way galaxy is visible in the red band.
Source: http://map.gsfc.nasa.gov/index.html
NEW! A third variation of this dataset is from the 5-year WMAP survey. The 5-year dataset is actually a series of images in different frequency bands and color scales. The first map in the animation is the Cosmic Microwave Background radiation fluctuations, which suppresses the signal from the Milky Way Galaxy. In the images that follow, the Milky Way Galaxy is not suppressed. A description of this animation can be found here: http://lambda.gsfc.nasa.gov/product/map/current/sos/7year/
Notable Features: First Year
- Red areas are warmer and blue areas are cooler
-
- The temperature range is ± 200 microKelvin
Notable Features: Third Year
- Data is polarized and higher resolution
- The Milky Way galaxy formed in the large red band
Notable Features: Fifth Year
- Animation includes frames in various frequency bands and color scales
Data Category
Major: Astronomy
Keywords:
Astronomy, Solar System, Milky Way, universe, WMAP
| Data Set Name | WMAP Microwave Background First Year |
| Data Set Directory Name | wmap_microwave/first_year |
| Data Set Source | NASA Image details |
| Data Set Developer | NASA WMAP Science Team |
| Visualization Developer | Steve Albers, NOAA/GSD |
| Audio | No |
| Download | FTP |
| Data Set Name | WMAP Microwave Background Third Year |
| Data Set Directory Name | wmap_microwave/third_year |
| Data Set Source | NASA |
| Data Set Developer | NASA WMAP Science Team |
| Visualization Developer | NASA Goddard Space Flight Center |
| Audio | No |
| Download | FTP |
| Data Set Name | WMAP Cosmic Microwave Background Year Five Freq and Polarization |
| Data Set Directory Name | wmap_microwave/fifth_year |
| Data Set Source | NASA |
| Data Set Developer | NASA LAMBDA |
| Visualization Developer | NASA Goddard Space Flight Center |
| Audio | No |
| Download | FTP |


 WMAP Microwave Background First Year (11 mb)
 WMAP Microwave Background Third Year (33 mb)
 WMAP Cosmic Microwave Background Year Five Freq and Polarization (1 mb)